

Product
Introducing Repository Access Permissions and Custom Roles
Socket now supports Custom Roles and Repository Access Permissions so organizations can control who can access specific repositories and actions.
By Joe Werle - Jun 19, 2026
April 21, 2026
4 min read


Today, we’re introducing Reports, a new page in the Socket dashboard for chart-based views of vulnerabilities, dependencies, and usage. At launch, Reports includes five built-in charts across three categories, with support for organization-wide and repository-level views. It replaces the previous Analytics page with a more structured reporting experience in the dashboard.
Built as an extensible reporting framework, the new page gives teams a more consistent way to work with and share Socket data across reviews, presentations, and recurring reporting workflows.

Security and engineering teams often need to communicate what they are seeing in Socket outside the product itself. That might mean preparing internal reviews, stakeholder updates, customer presentations, recurring readouts, or planning decks. Until now, turning that data into something reusable usually meant rebuilding charts by hand or stitching together one-off screenshots from different parts of the dashboard.
The new page makes that work easier to do directly in the dashboard.
Rather than scattering one-off visualizations across the product, Reports brings chart-based reporting into one dedicated page. Teams can start with an organization-wide view for broad visibility, then narrow to a specific repository when they need more targeted analysis.
At launch, Reports is organized into three categories:
Within those categories, Reports currently includes five built-in charts:
The first set of reports focuses on vulnerability data through security frameworks teams already use to understand risk.
The Top 25 CWEs chart shows how often each category appears in the selected organization and, if applicable, a specific repository. This gives teams a direct view into which weakness categories appear most often across the selected scope, while keeping the results grounded in a framework that security teams already recognize.


The Top 10 OWASP report provides a similar view across OWASP categories, making it easier to see which classes of application security issues are showing up most frequently.

Both reports support alternate sort orders, which makes them useful in different contexts. Teams can sort by occurrences or OWASP rank, depending on whether they want to see the most frequent categories first or view them in the framework’s default order.
Reports also includes two dependency-focused charts designed to help teams understand what is in their dependency graph and how healthy those packages are overall.
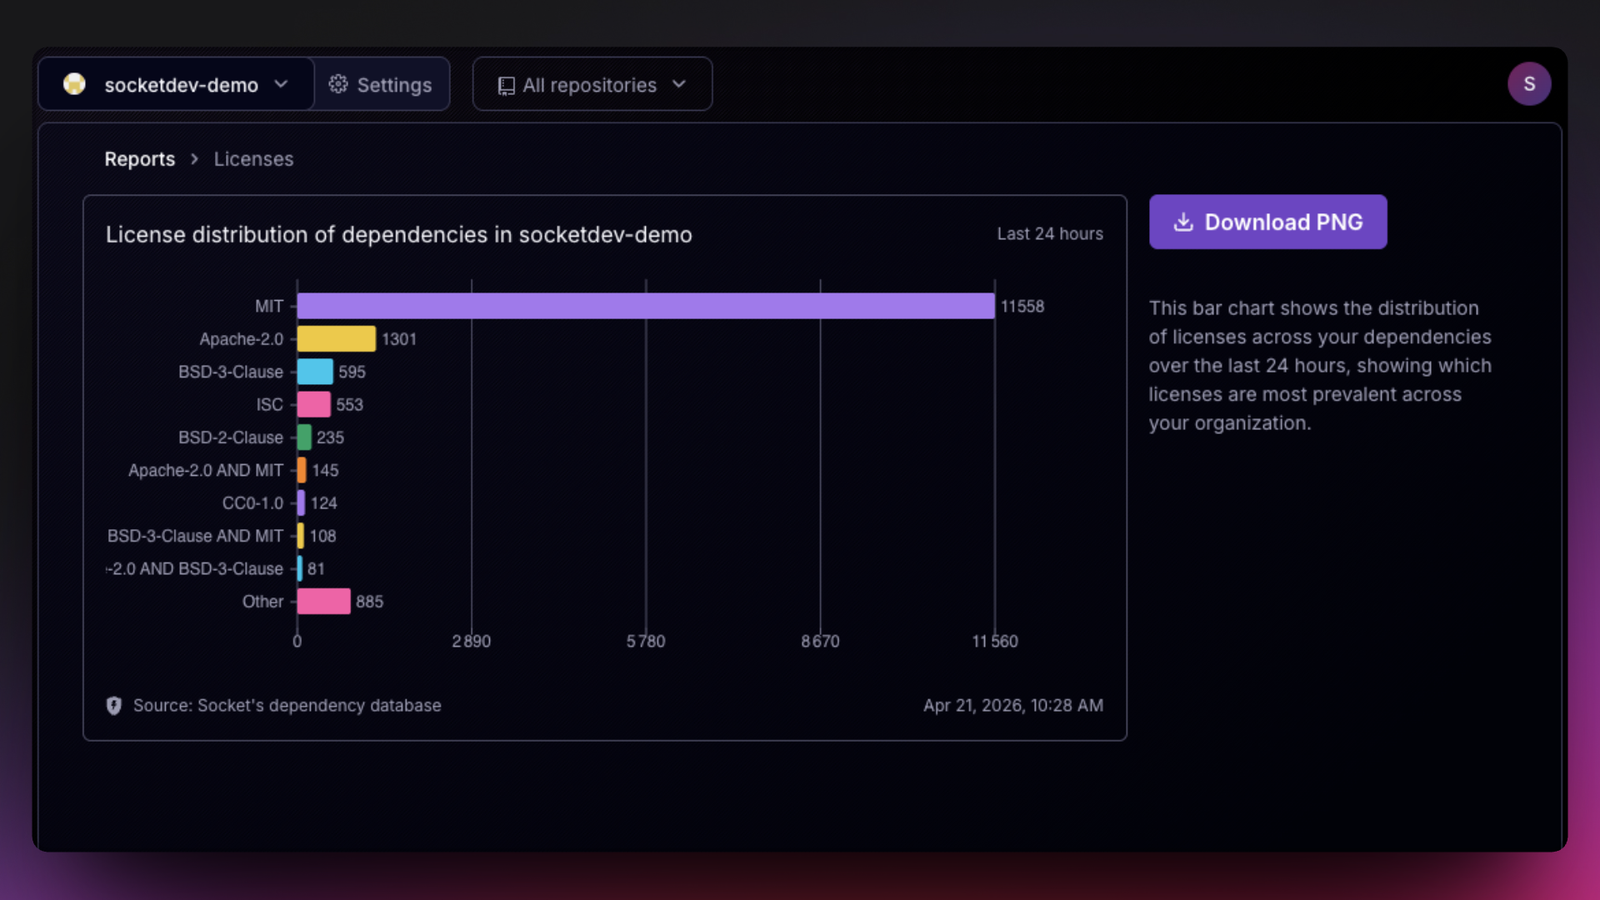
The Licenses report shows the distribution of licenses across your dependencies. It gives teams a quick way to see which licenses are most prevalent across an organization or repository, while still making room for the long tail.
The Score Distribution report shows the distribution of dependencies by their overall Socket score, or another selected score category. Scores are grouped into buckets, which makes it easier to see whether packages are clustering in healthier ranges or drifting toward categories that suggest more risk.

This view is especially useful because it shows how risk is distributed across a dependency set instead of collapsing package health into a single summary number. Teams can quickly tell whether the overall picture reflects a strong baseline, a concentration of medium-risk packages, or a long tail that deserves closer review.
The score distribution view also supports multiple score categories, including overall score and more specific dimensions such as vulnerabilities, supply chain risk, maintenance, and quality. That gives teams a more flexible way to move from a broad view of package health to a more specific understanding of what is driving risk.
Reports also introduces a usage-focused chart for operational visibility.
The Events report shows the number of Firewall events per day over time, broken out by event type. That gives teams a straightforward way to understand activity patterns and see how Socket usage is showing up across the selected scope.
Presented as a time series chart with event-type filtering, it is useful both inside the dashboard and in the materials teams create from it. Like the other charts in Reports, it is meant to support analysis and communication, not just in-product viewing.

Every chart in Reports can be exported as a PNG for reuse in slides, docs, presentations, and recurring reporting workflows. The reports are designed as durable outputs, not just dashboard widgets. They reduce manual chart-building for reviews and presentations and give teams a faster way to turn Socket data into shareable reporting artifacts.
Reports is also built as an extensible reporting framework inside the dashboard. Each chart follows the same structure for scoping, controls, explanatory context, source labeling, and export, creating a consistent foundation for expanding chart-based reporting over time without introducing a different interaction model for every new view.
The new Reports page is available now in the Socket dashboard.
We are rapidly expanding the reporting framework with additional charts and views over time, with new charts guided by customer feedback. If there’s a chart you’d like to see, contact Socket support or use the feedback button in the top-right corner of the Reports page.
Try Reports in the Socket dashboard today to explore chart-based views of vulnerabilities, dependencies, and usage, and export the charts you need for reviews, presentations, and internal reporting.
Subscribe to our newsletter
Get notified when we publish new security blog posts!
Product
Socket now supports Custom Roles and Repository Access Permissions so organizations can control who can access specific repositories and actions.

Product
Socket MCP now lets AI assistants review org alerts, investigate threats using the Socket threat feed, and inspect package files in addition to dependency scoring.

Product
Socket Firewall blocks malicious VS Code and Open VSX extensions before install, protecting developers from compromised editor marketplaces.